Getting Started
Getting Started
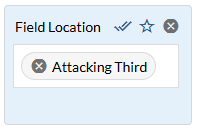
Filters
Filters allow you to narrow the scope of your research and answer more granular questions about player and team performance. For example, imagine you are trying to answer three questions:
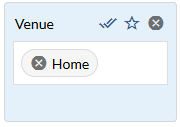
How does a team perform at home?
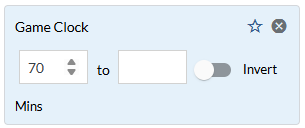
How about after the 70th minute in the match?
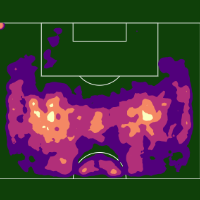
Does field location affect a player’s pass percentage?
Each of these questions is answered by applying a new filter.
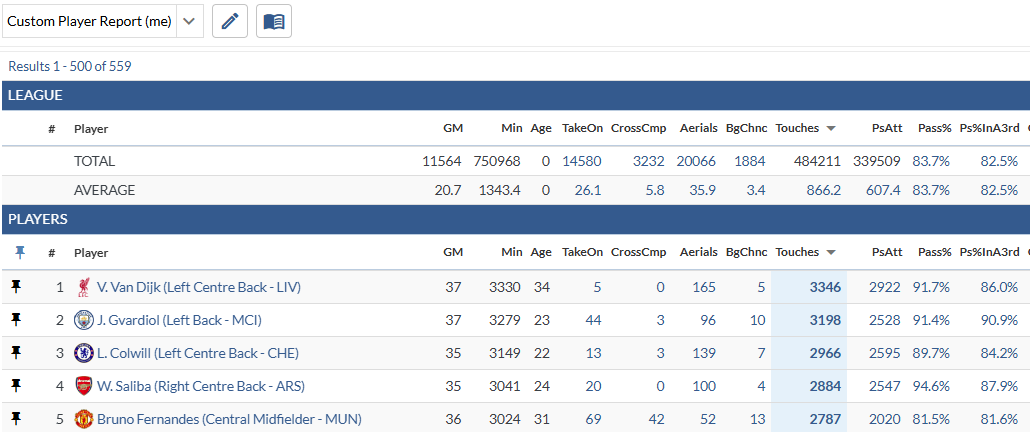
Custom Reports
A report is a saved group of stats and there are two types of reports:
Native Reports - generic reports provided by Provision.
Custom Reports - reports that you create.
The Custom Report Builder allow you to create a new, unique report that includes only the stats you want. These reports are available everywhere on Provision including on leaderboards, individual team and player pages, and Custom Pages.
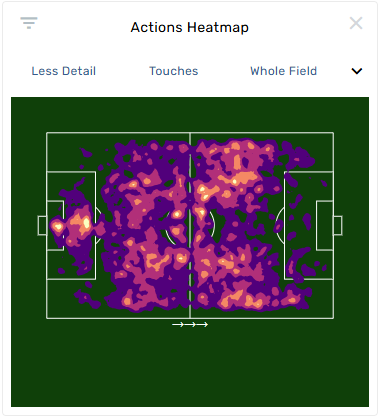
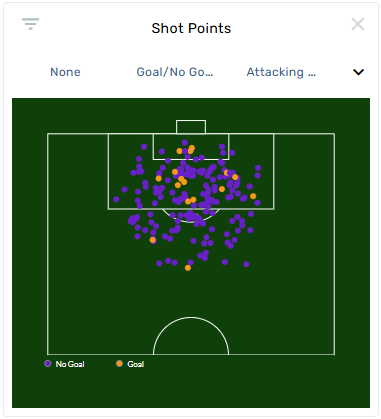
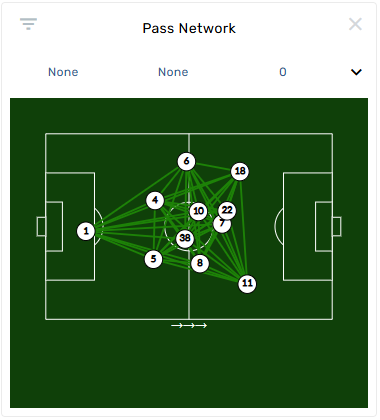
Graphics - Team & Player Pages
These visualizations help organize information and simplify data into actionable insights for player and managers. Each graphic has custom settings that allow you to tailor it to your team’s core principles.
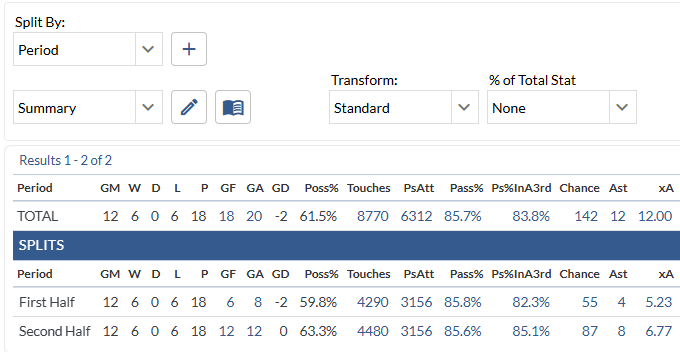
Splits Table
Look at the splits on any report in your team’s Provision library and apply two or more splits for more granular analysis. Combined with filters and graphics, this tool helps paint a clear picture of player and team performance.