Table Tools
Calculations
Export
Qualifications
Stats View
Group By
Contact Us
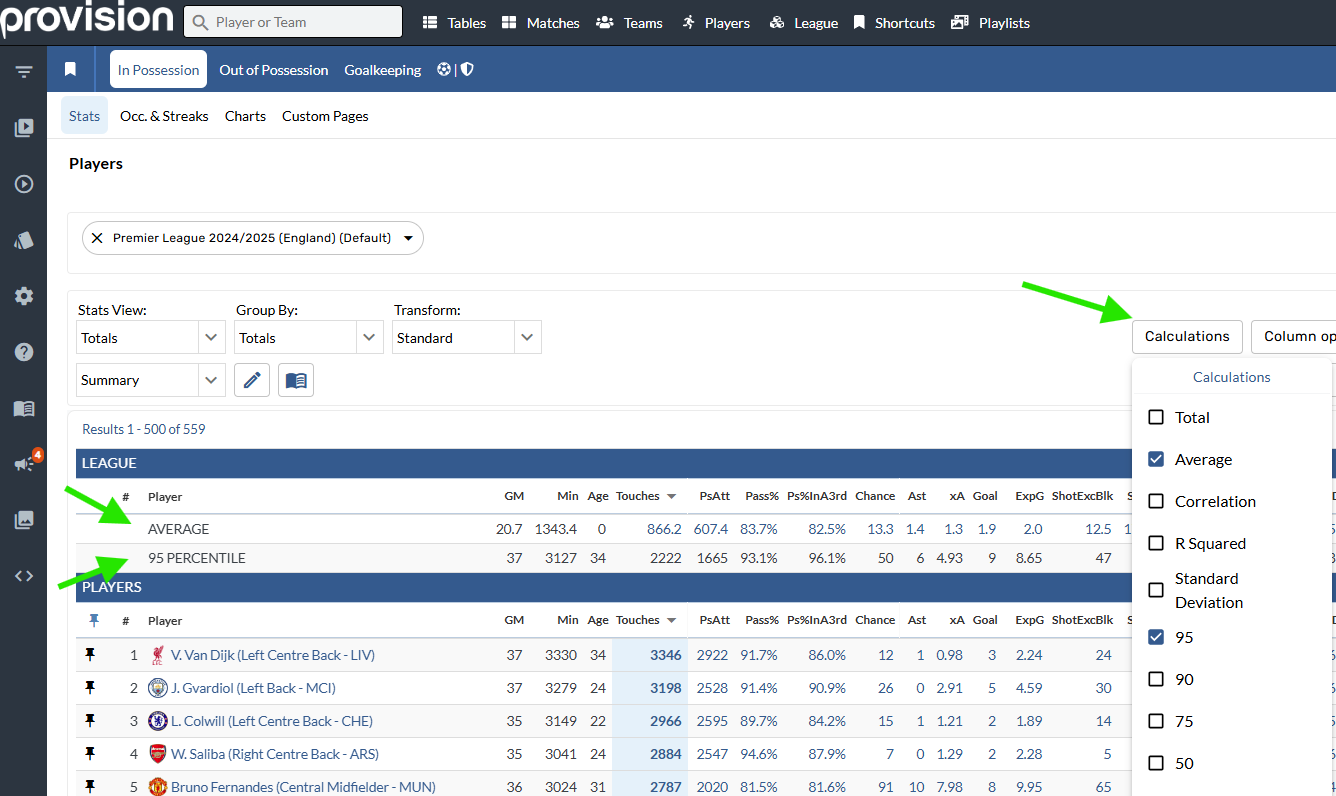
Calculations
Add / remove table calculations
Open the Calculations menu.
Tap the box next to a calculation to add or remove from the table.
These calculations will also run on a selected Pinned List.
Exports
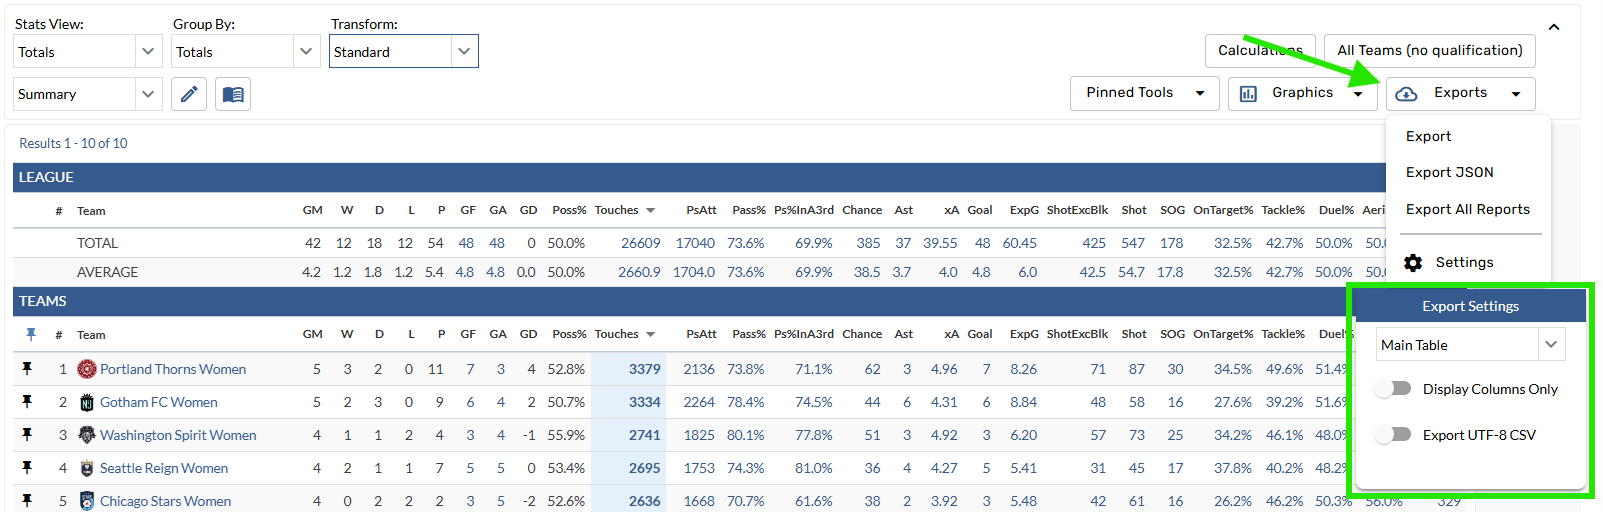
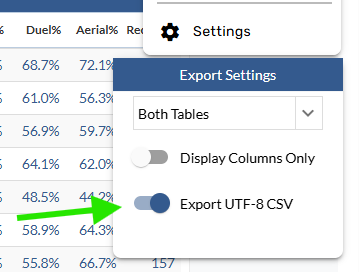
Settings
There are three export settings options:
Main Table: Exports the individual rows in the table and omits the calculations.
Calculations Table: Exports only the Calculations section.
Both Tables: Exports all data.
Toggling on Display Columns Only will only include the columns displayed on the table.
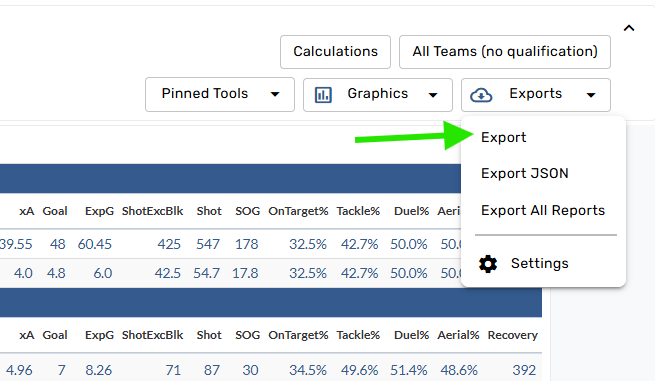
Export to Excel or Numbers
Open the Exports menu.
Tap Export (the top option) from the menu.
Tips and Tricks
To remove unwanted characters in the CSV, toggle on “Export UTF-8 CSV” in the Export Settings.
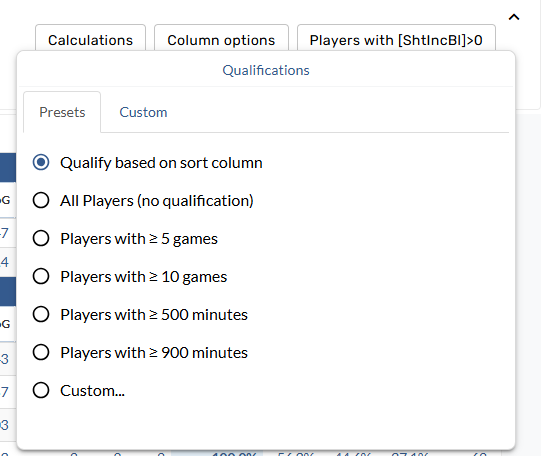
Qualifications
This tool defines the sample of teams or players that qualify for a leaderboard. By default, the table qualification is based on the sort column.
Preset Qualifications
There are several preset options available on both team and player leaderboards. Selecting one of these options will automatically apply the qualification to the table.
Custom Qualifications
Custom qualifications can be applied by manually setting the qualification criteria in the Custom tab of the Settings window. Select the stat(s) in the section below, set the desired threshold, and apply to the table using the '+' icon.
Select Qualifications > Custom.
Choose a stat, math function, and number value in the Add Qualification menu.
Tap the plus button to update the leaderboard.
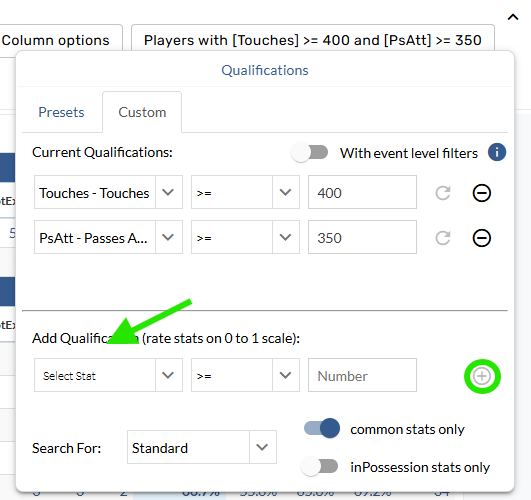
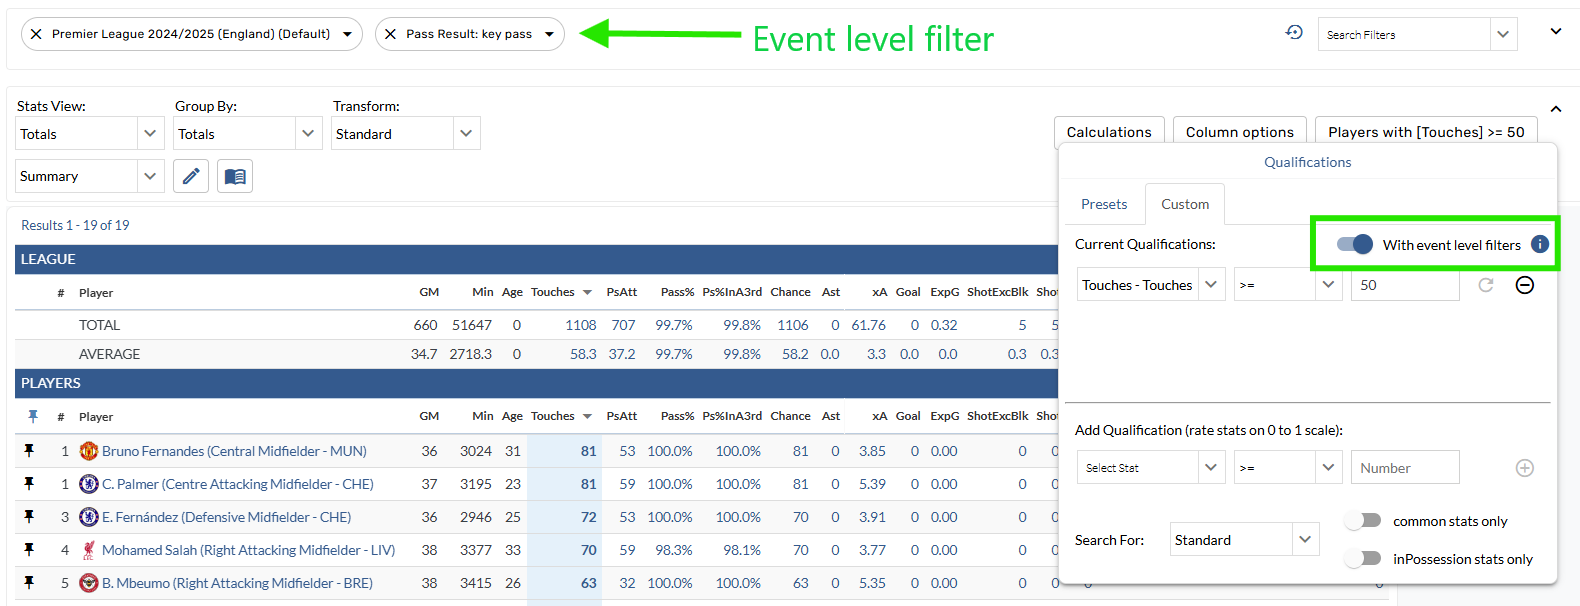
With event level filters
Open the Qualifications menu.
Tap the “With event level filters” option.
This allows you to qualify based on stats while using event level filters such as Pass Result or Shot Distance. For example, this shows only players with 50 or more touches when the pass result was a key pass.
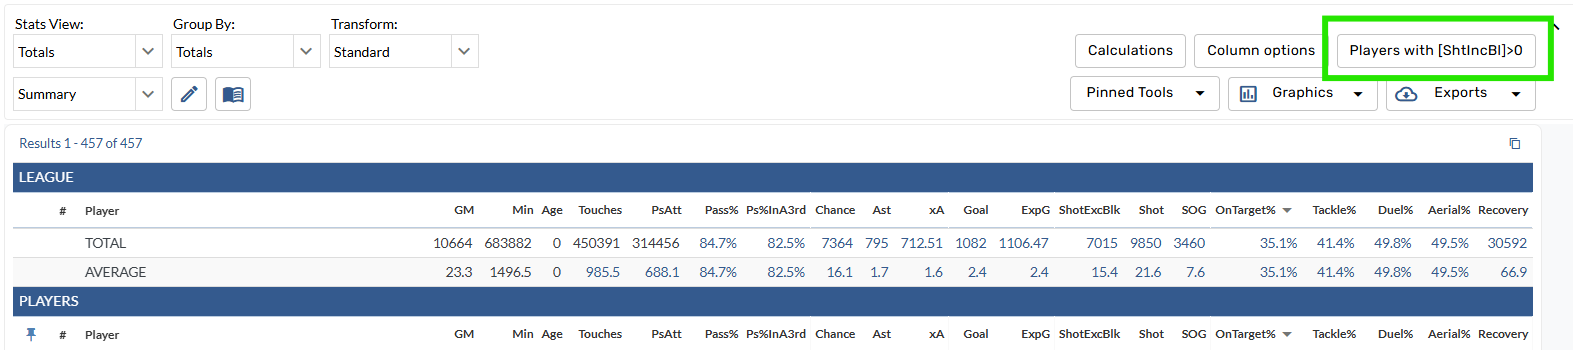
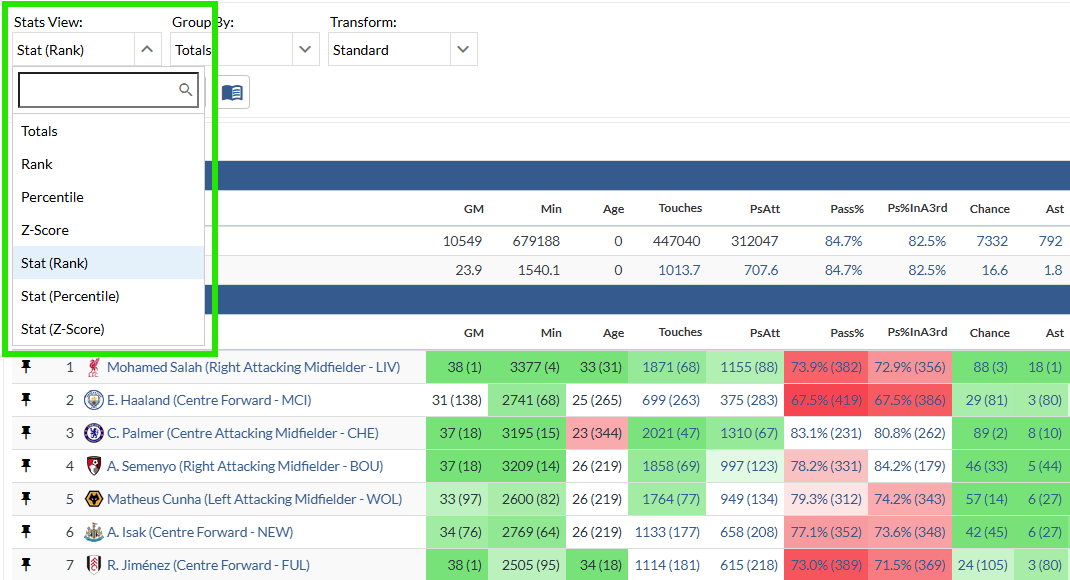
Stats View
Compare performance around the league by adding context beyond the raw statistics. Rank, Percentile and Z-Score views also add a color-coded component, with the top 30% shaded green and the bottom 30% shaded red.
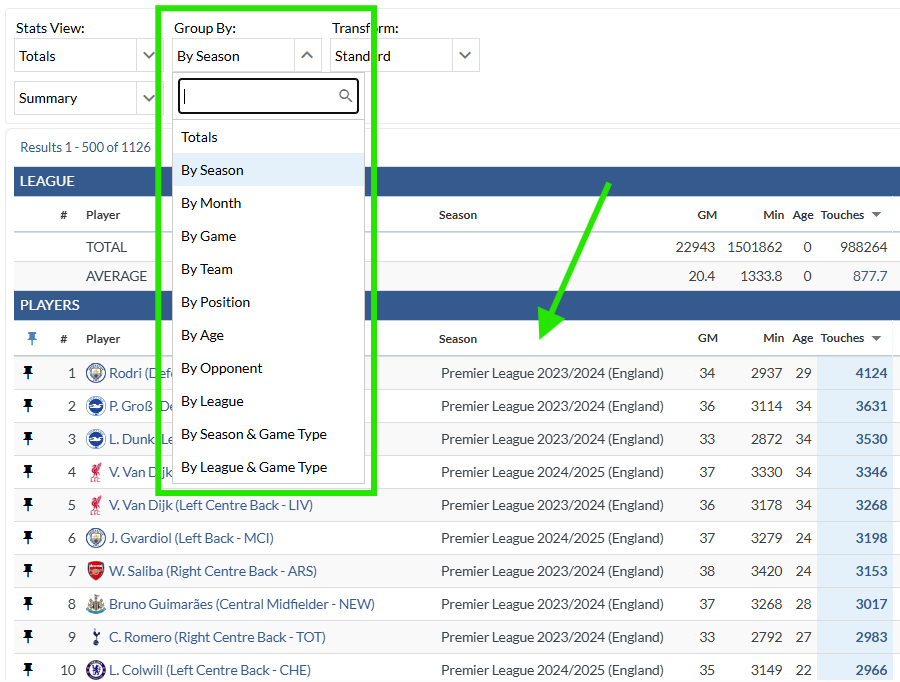
Group By
Customize the grouping of data on a leaderboard. For example, grouping By Season will show one row per player per season. This helps answers questions like “Which player had the most touches in a season over the last four seasons?” or “Which player had the most shots on target in a game in the 2024/2025 season?”
Contact Us
Email the Support Team